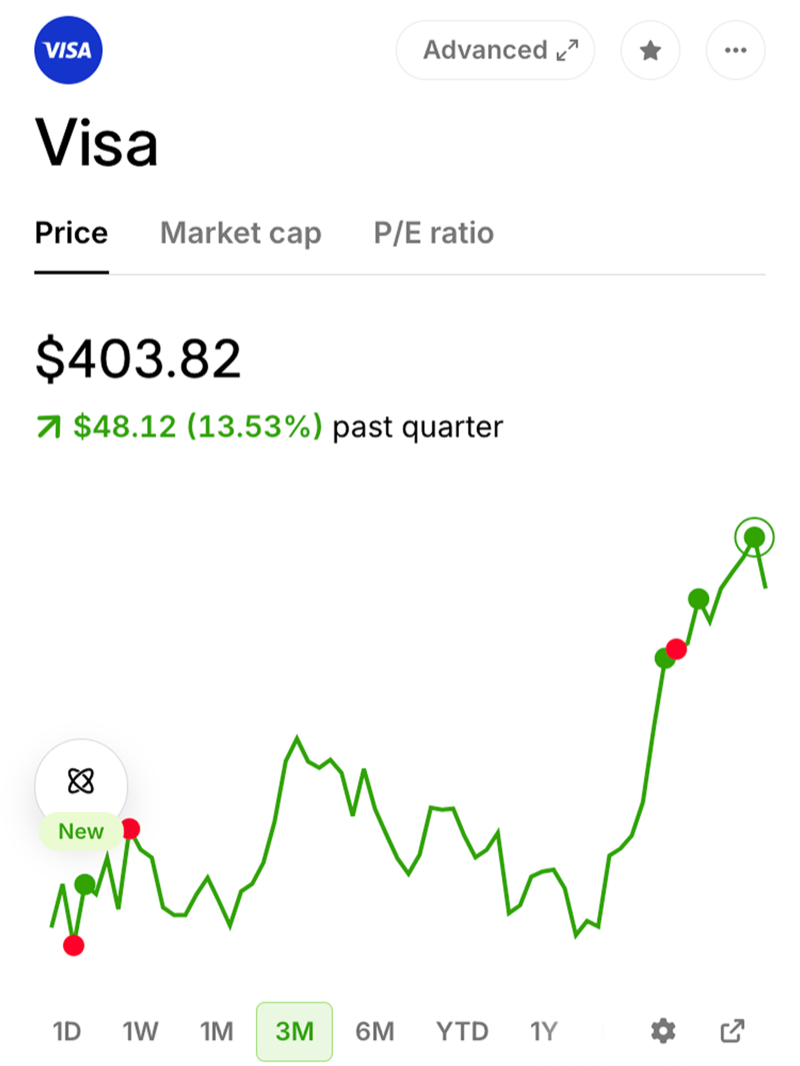
Public.com Web
I created the web experience for Public.com. By bringing the investing app to the web we created opportunities for deeper research and comparison.
- Designed the web platform for a mobile-first investing app.
- Created features for browsing and discovery.
- Designed an index comparison tool.
- Created a responsive news style for content pages.
- Launched web and mobile web to keep pace with the app.
Rethinking mobile-first for the web
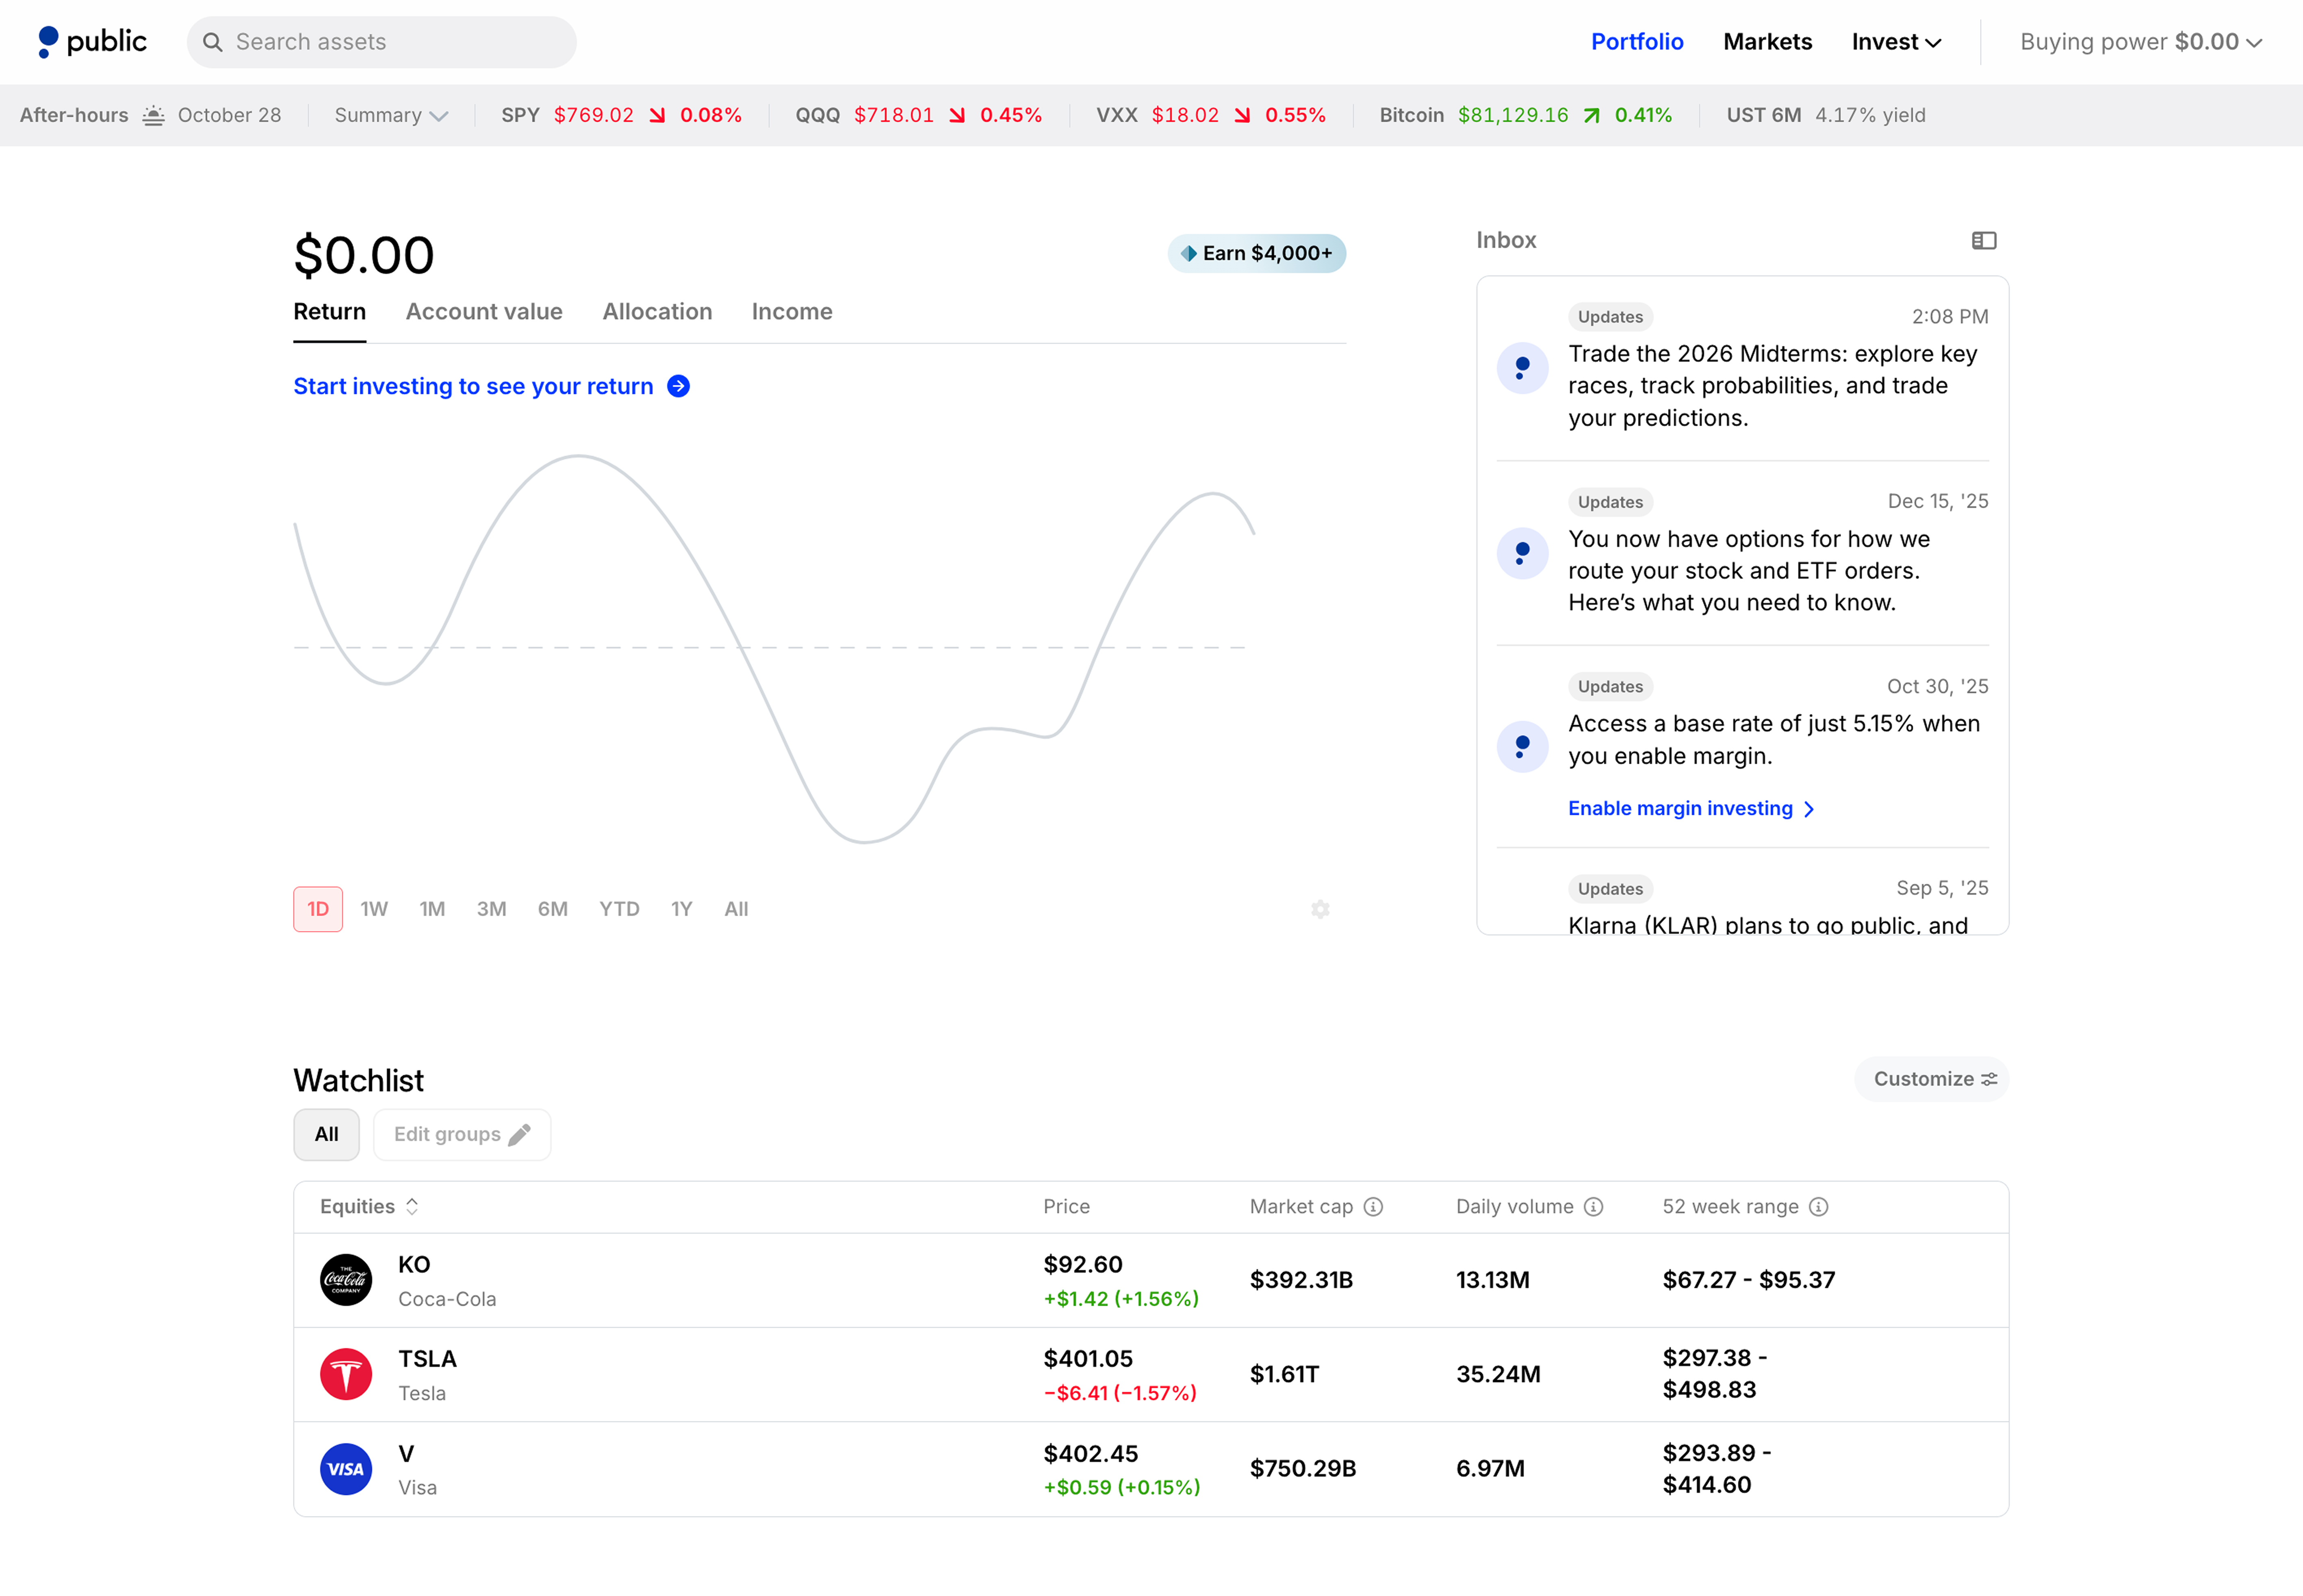
Public.com started on mobile, but SEO and marketing pushed web sign ups. My priorities were to build a homepage for management and asset pages to drive registrations.
For the homepage, I looked at mobile usage and gave the most popular mobile screens their own permanent space. The larger area made comparisons and trends easier to see. The architecture worked well and is still in place 4 years later.
Focus on browsing and discovery
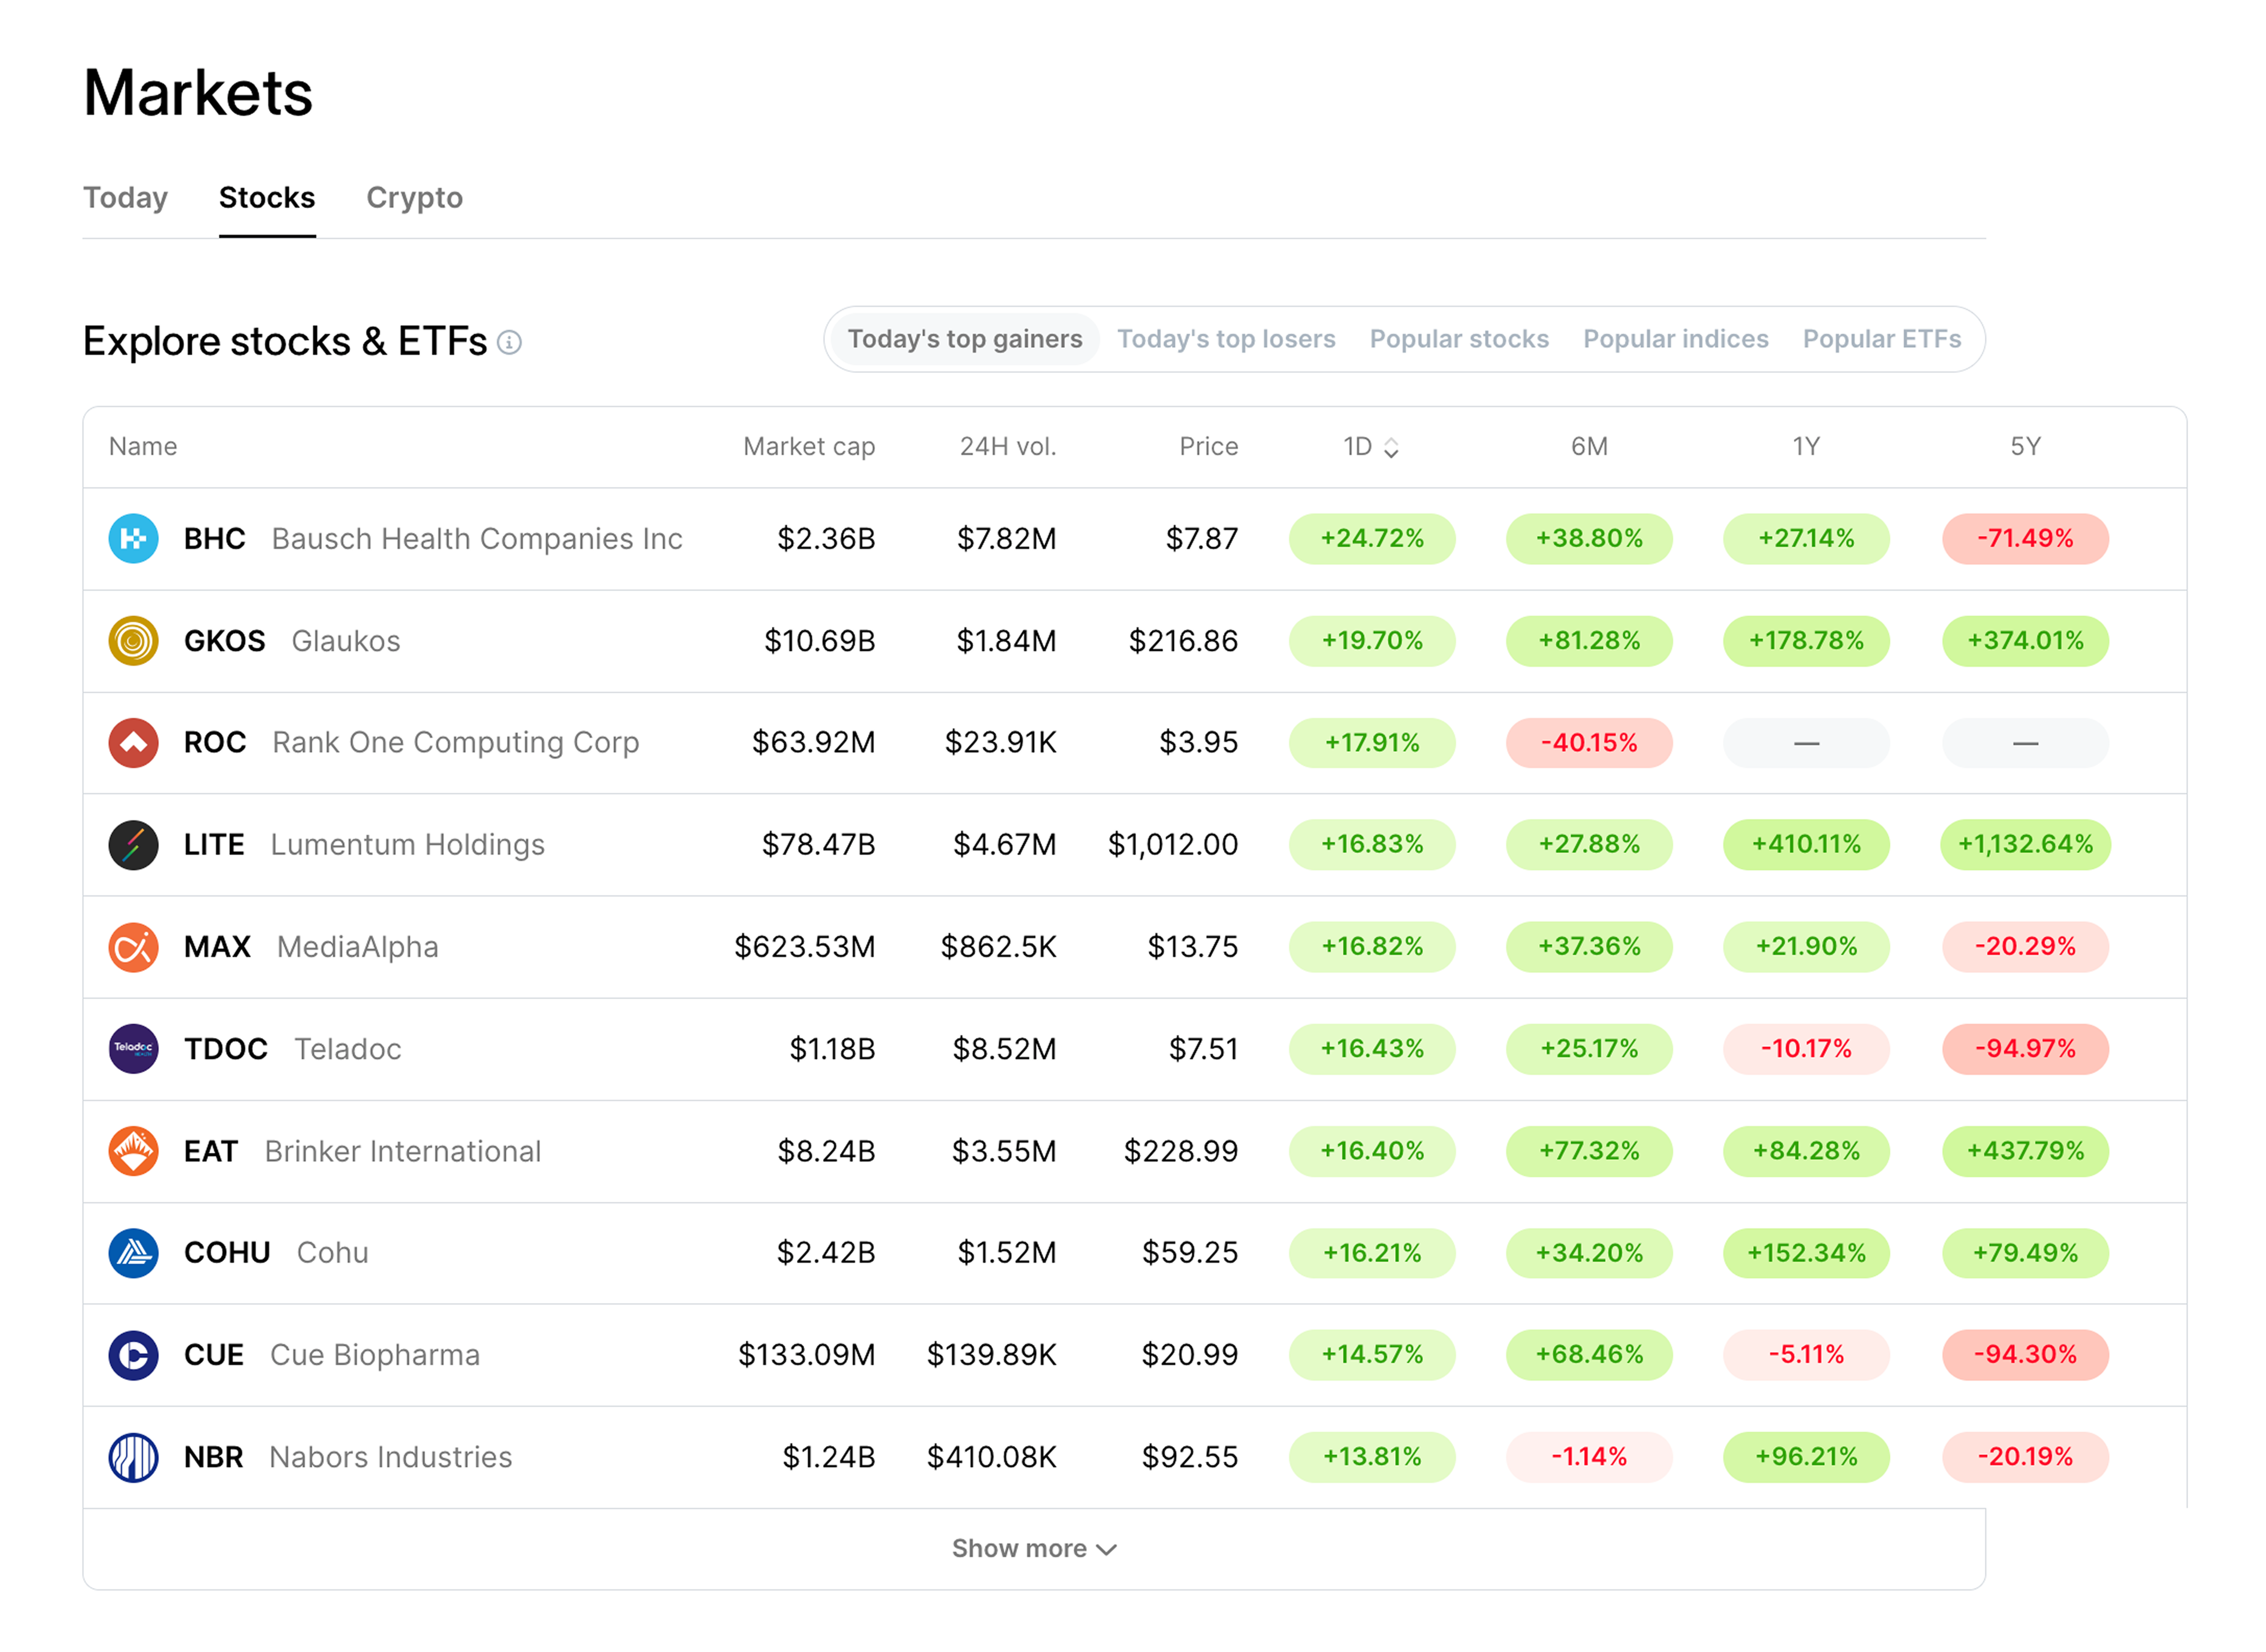
A large number of our users were new investors, so education and simplicity were guiding principles.
For the Markets page, I created bite-sized, scannable tables that explained trends. The larger size gave greater depth to research and discovery. The table design worked for existing customers looking deeper and for logged-out acquisition pages.
Index comparison
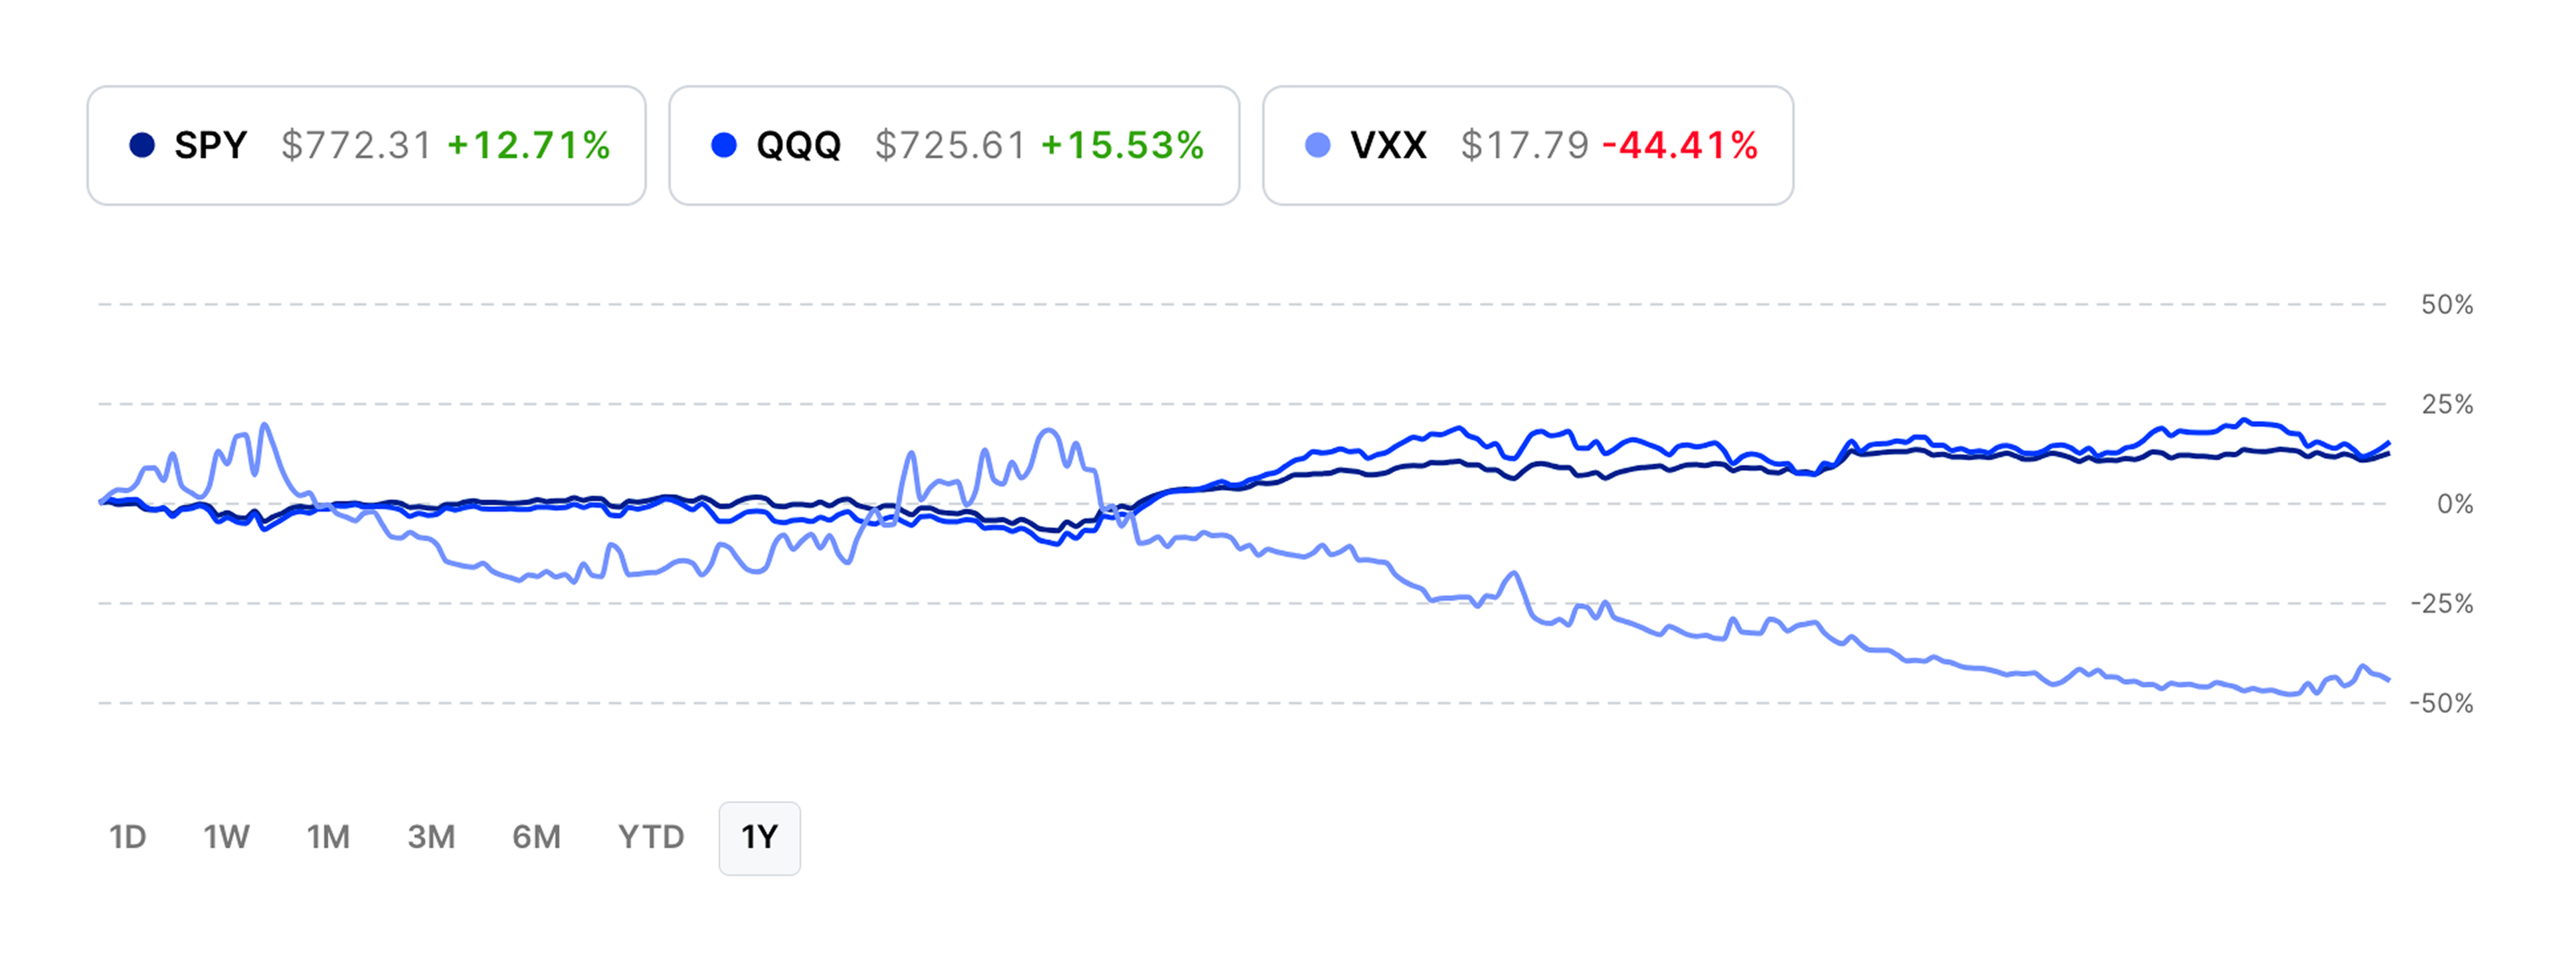
Part of new investor education was introducing index funds and explaining how those could track trends in the Market. We created an index comparison tool that showed funds over time.
The larger size of the web allowed greater prominence for comparison tools like this. I compared % gain to compare indexes that varied in price.
A responsive news style for content
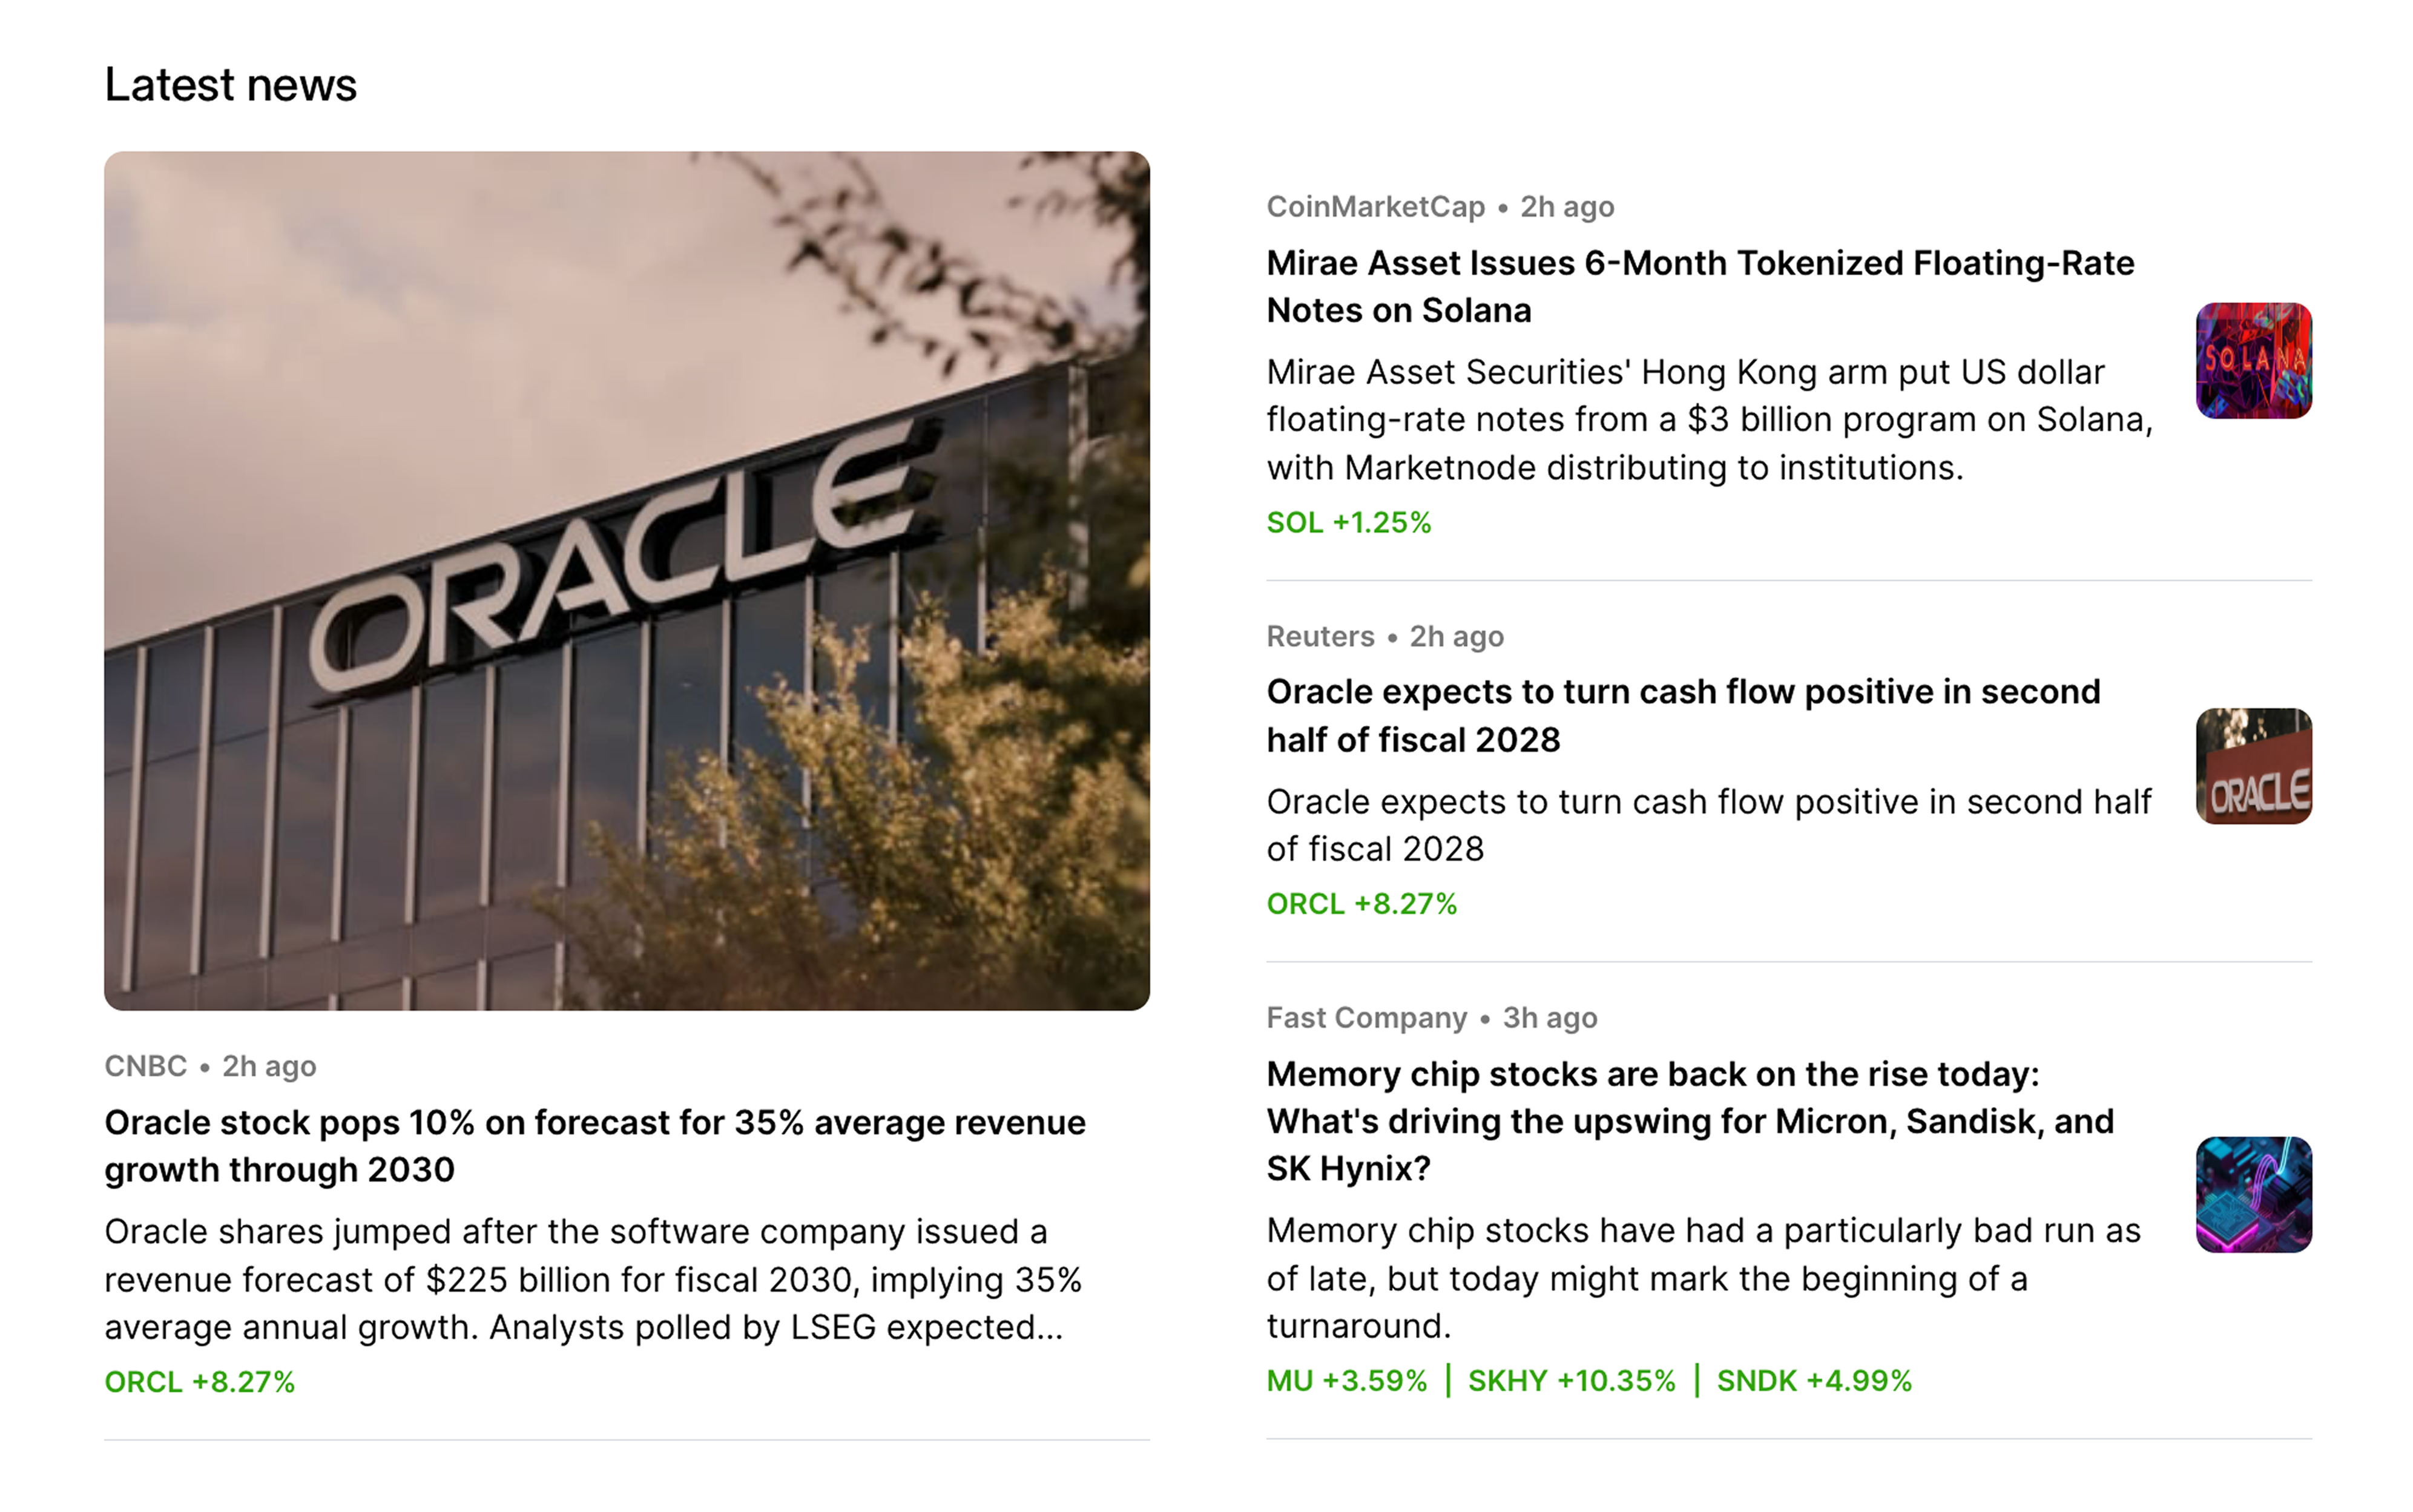
The larger web size created more opportunities for investing news. Where it had been a footnote before, it could be a primary focus now.
I created a news style and a responsive grid. By creating story hierarchies I gave users a clear entry point. Each story listed tickers and the size of that day’s move. The responsive grid resized to multiple screens.
A clear, usable, and elegant design
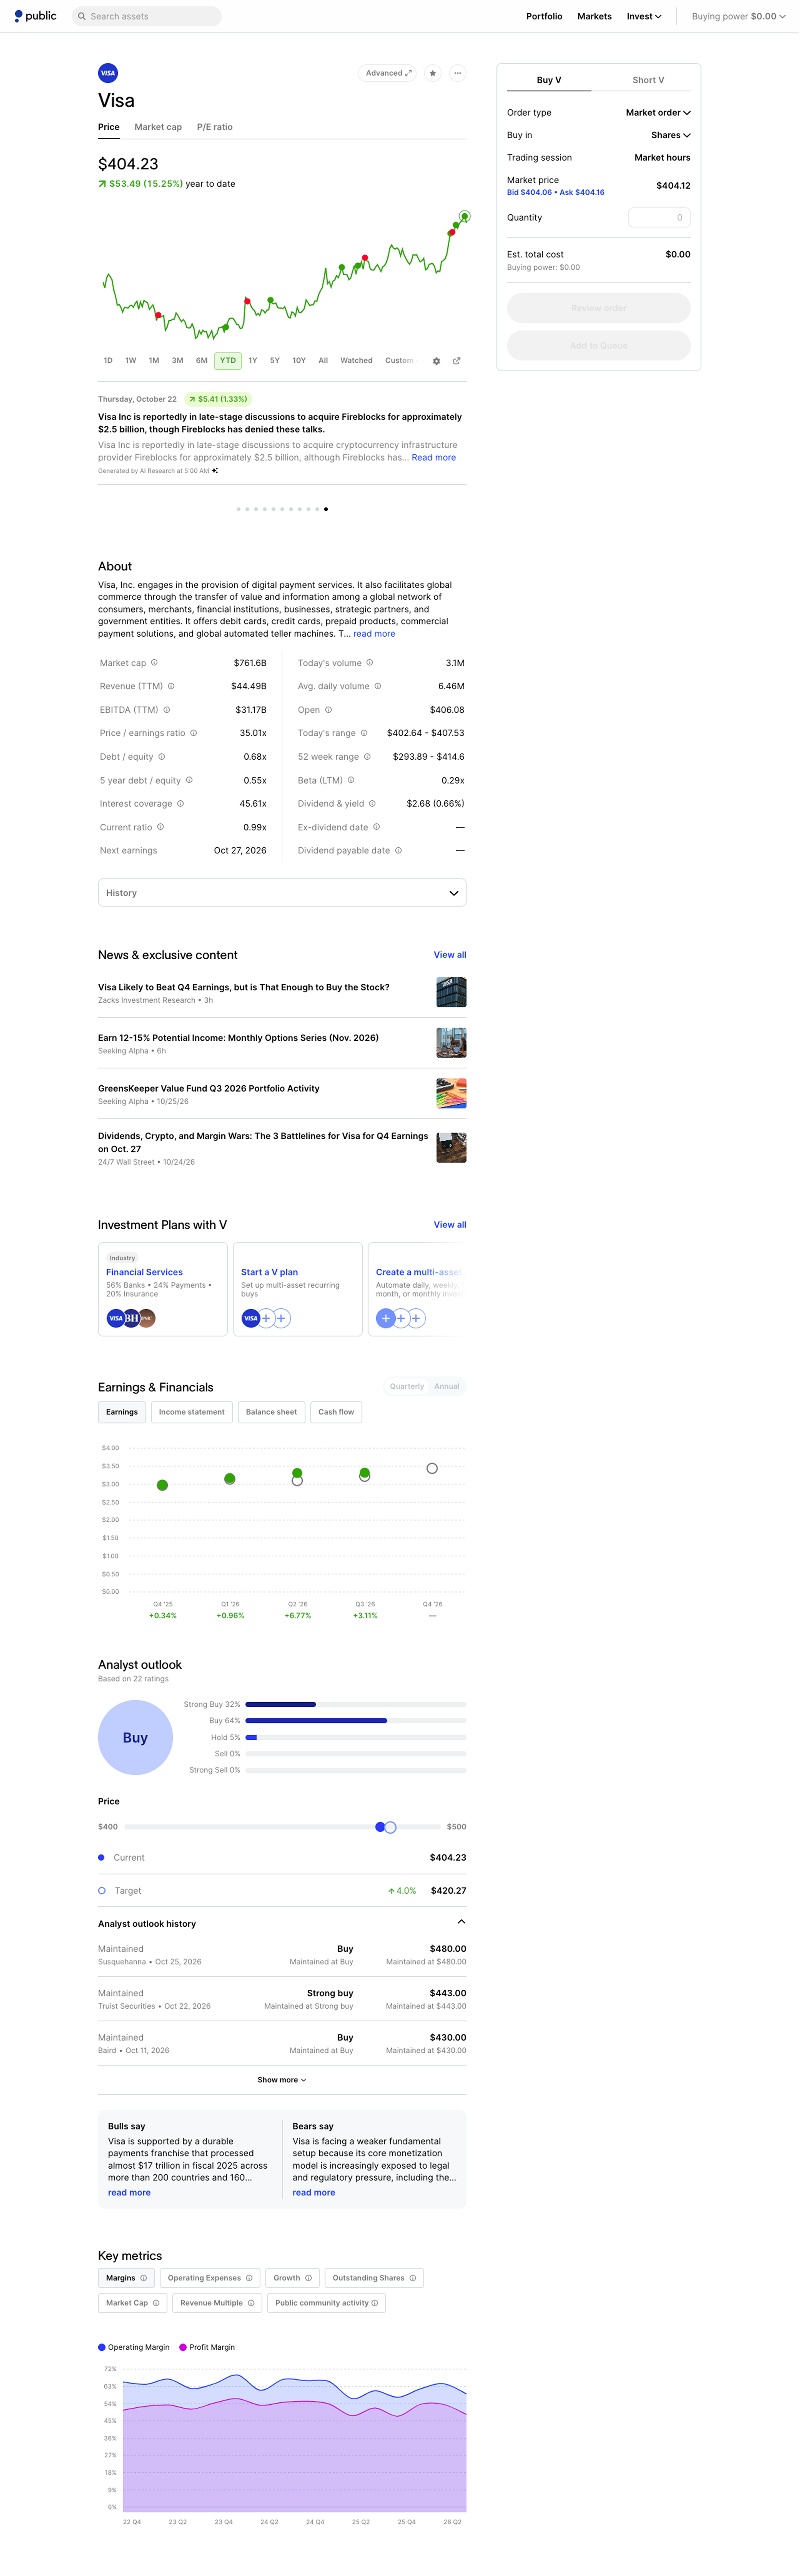
The launch of Public.com's web experience was a clear evolution of the product and became popular with the core users. Our members completed trades from the web easily, and the market and comparison pages scaled as the company expanded into new asset types.
The web experience became its own platform and encouraged learning and discovery. My minimalist design allowed charts and data to take the center stage and has remained consistent since its launch in 2022.