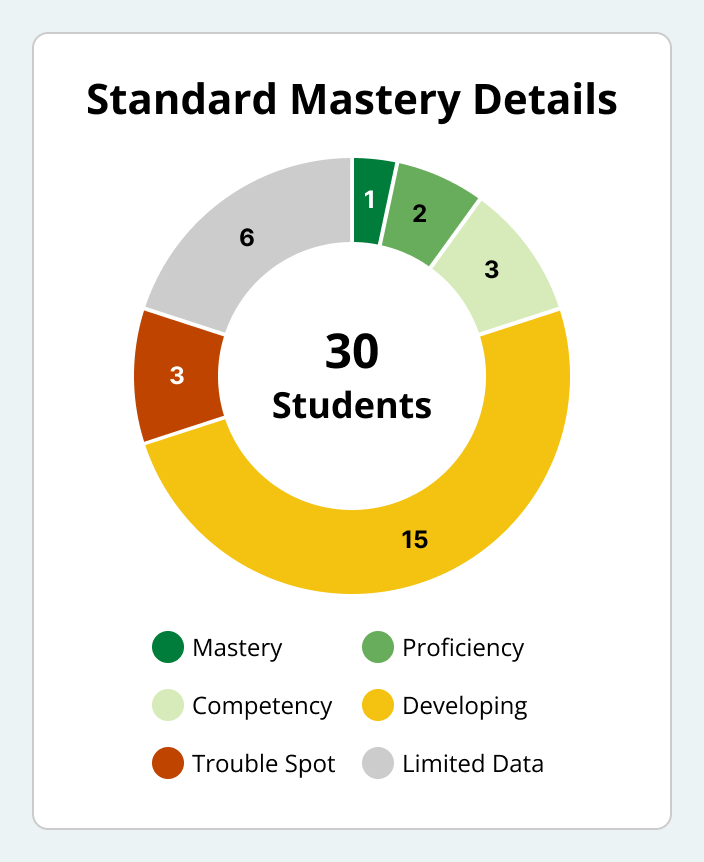
Student Mastery Monitoring
I designed Student Mastery Monitoring, a teacher view that tracks K-12 students' progress toward state standards. I created color-coded mastery levels, and the system shaped how Study.com presents standards data to school districts.
- Designed a class snapshot for every state standard.
- Created a system to assess state standards and their component skills.
- Grouped students into cohorts with recommended actions.
- Launched a beta with hand-picked school districts.
A class snapshot for every standard
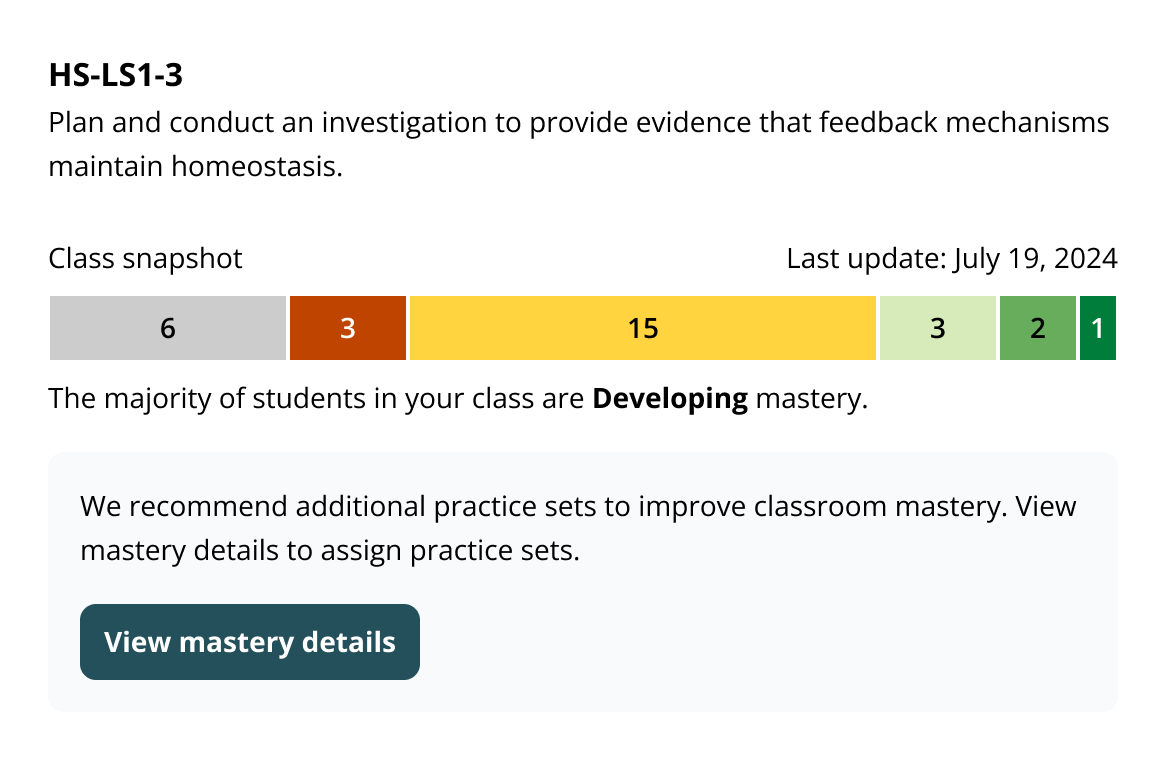
K-12 schools measure progress toward state standards, like HS-LS1-3, a high school biology standard on homeostasis. Teachers needed group views to quickly see how many students had reached proficiency.
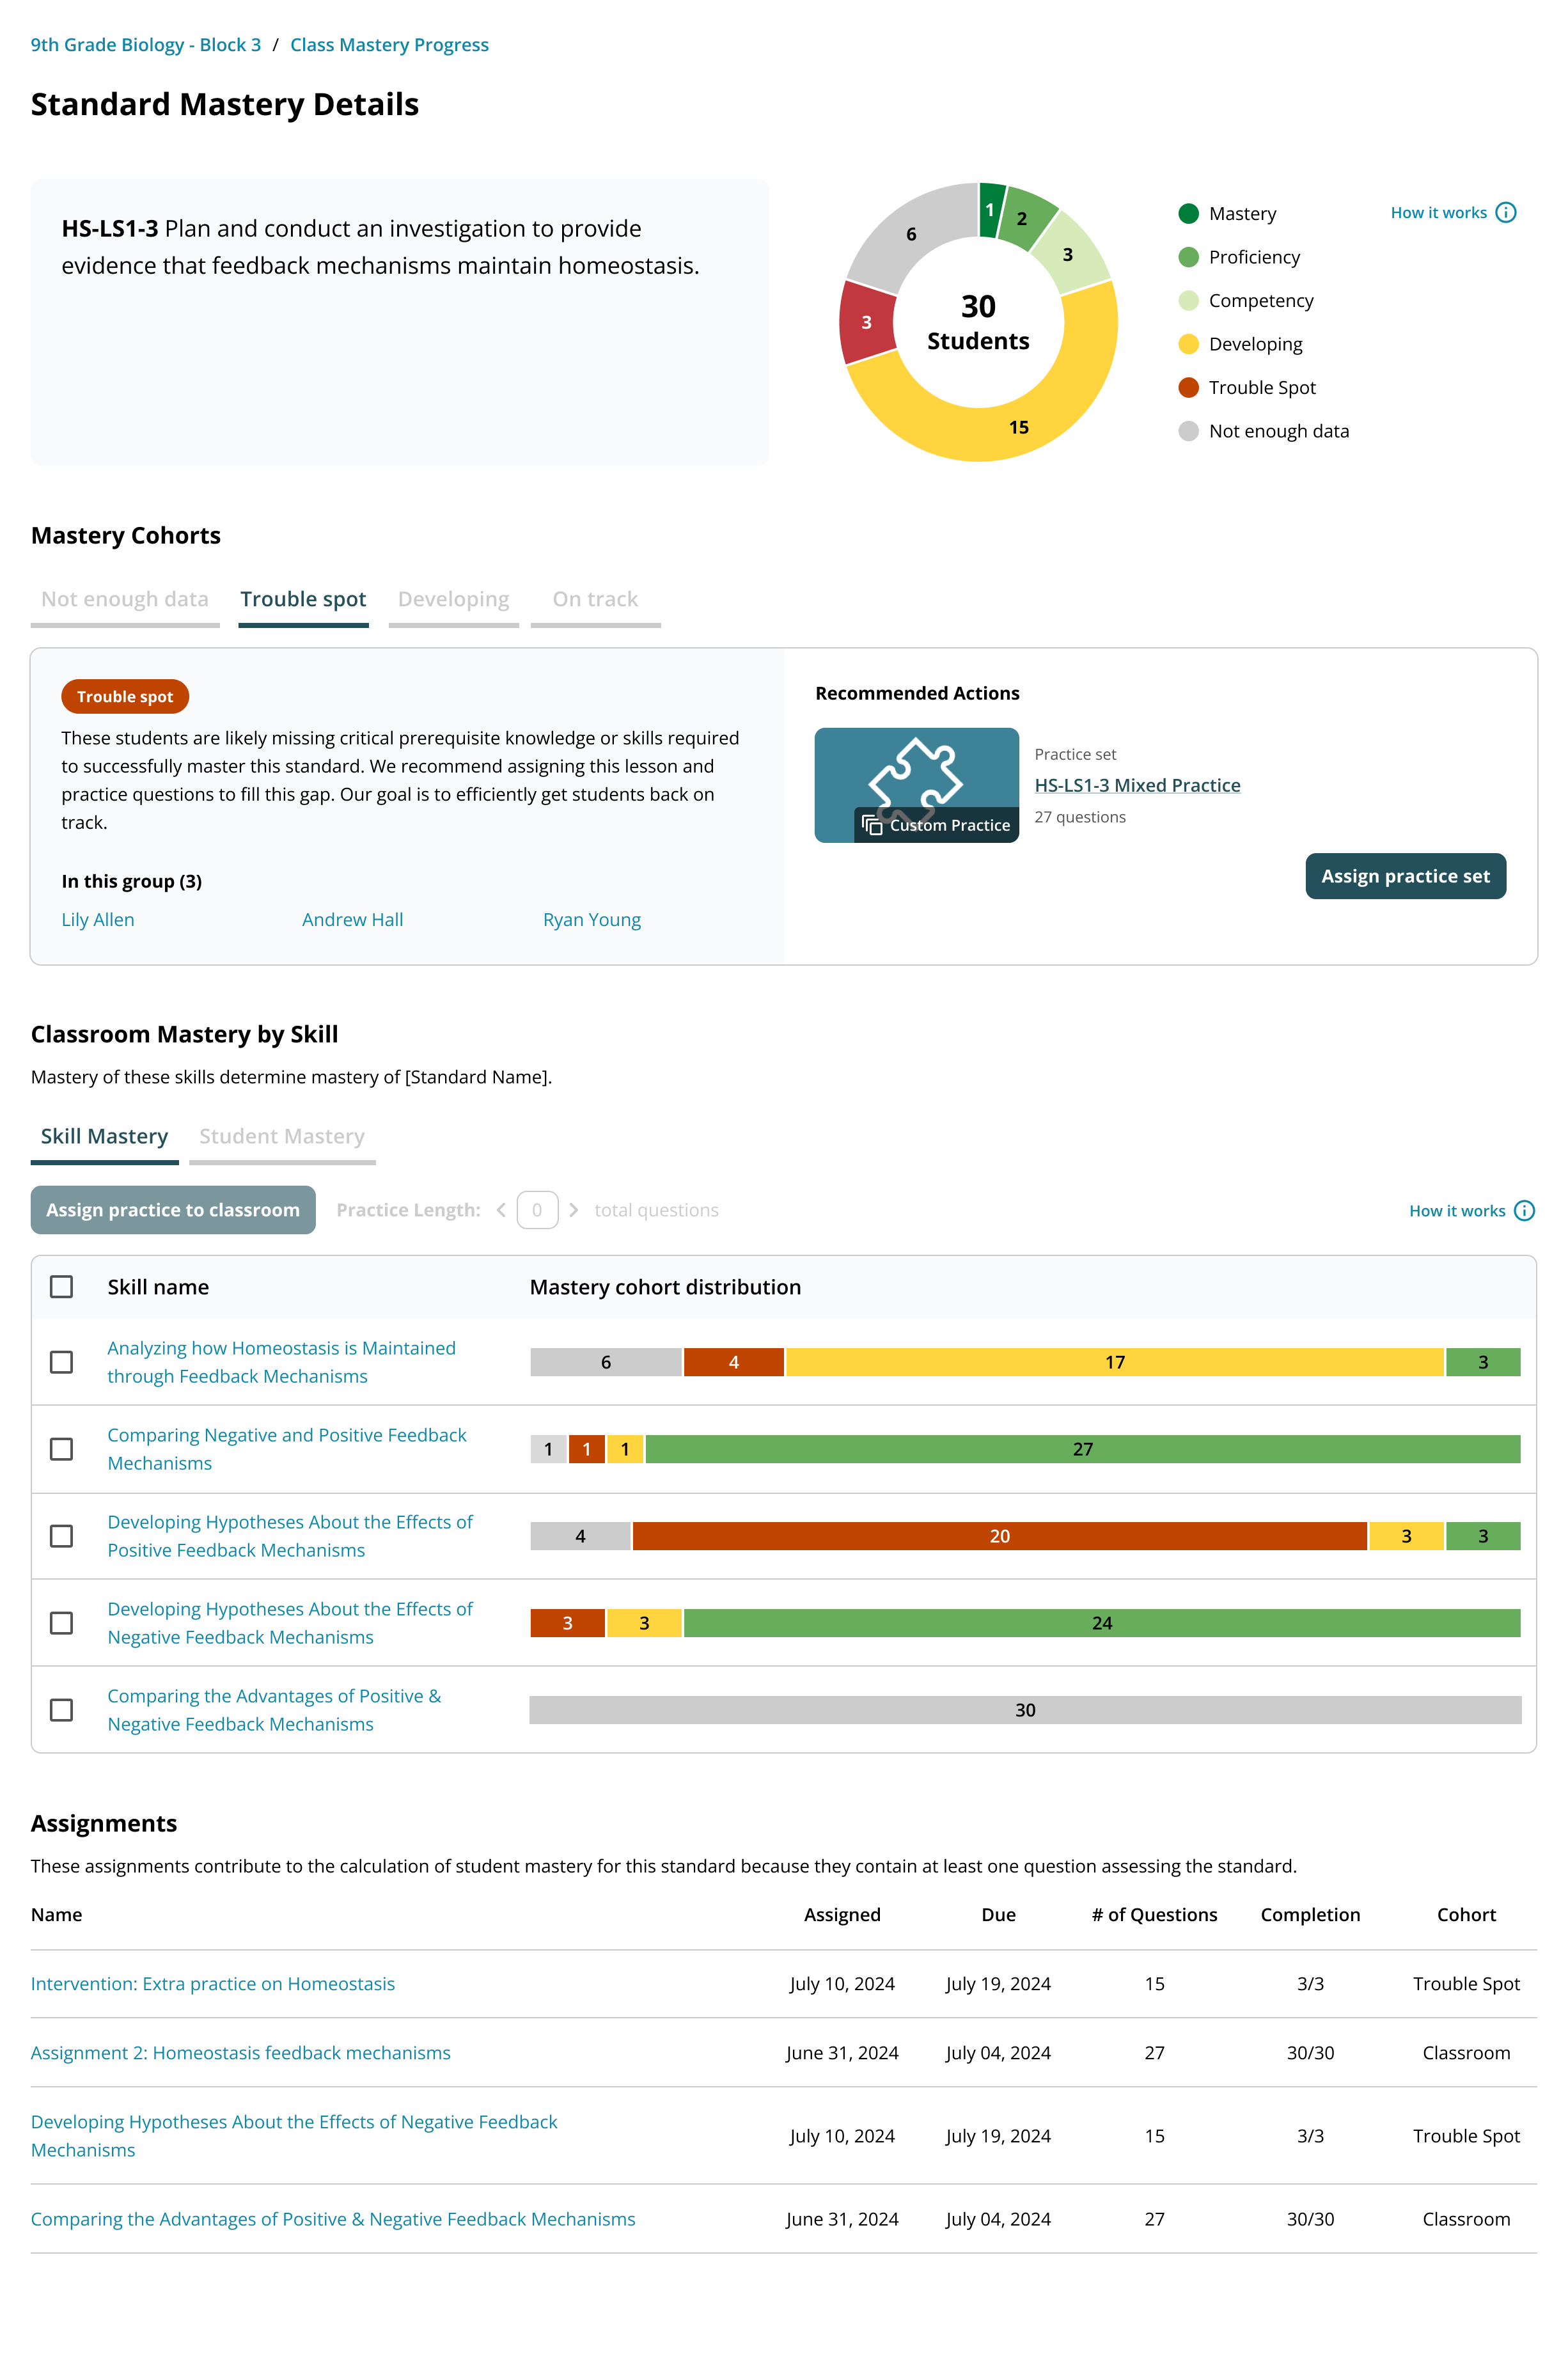
I designed a class snapshot that translated results into colored bars with understandable summaries beneath them. Each snapshot ended with a recommendation and direct actions based on the class mastery level.
The skills behind each standard
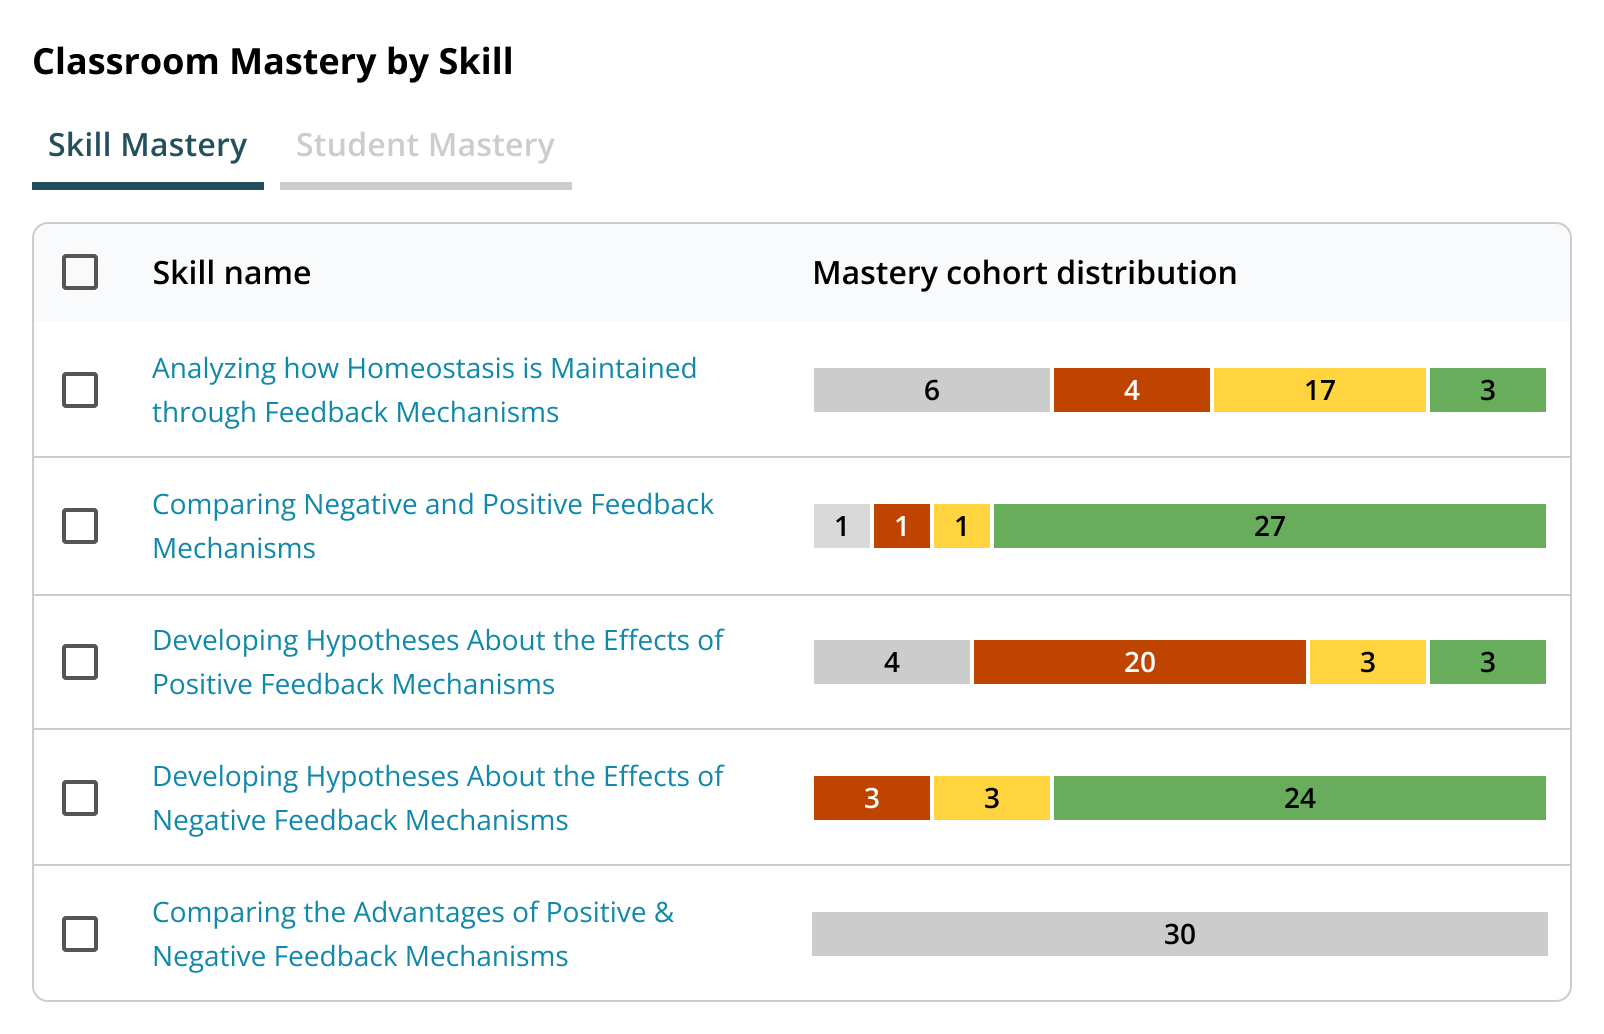
A standard is made up of several smaller skills, and a class can be strong in one and struggling in the next. Classroom Mastery by Skill showed each skill’s distribution side by side.
Teachers could select the weakest skills and assign practice to the whole class in one step. A second tab showed the same data student by student.
Cohorts with a next step
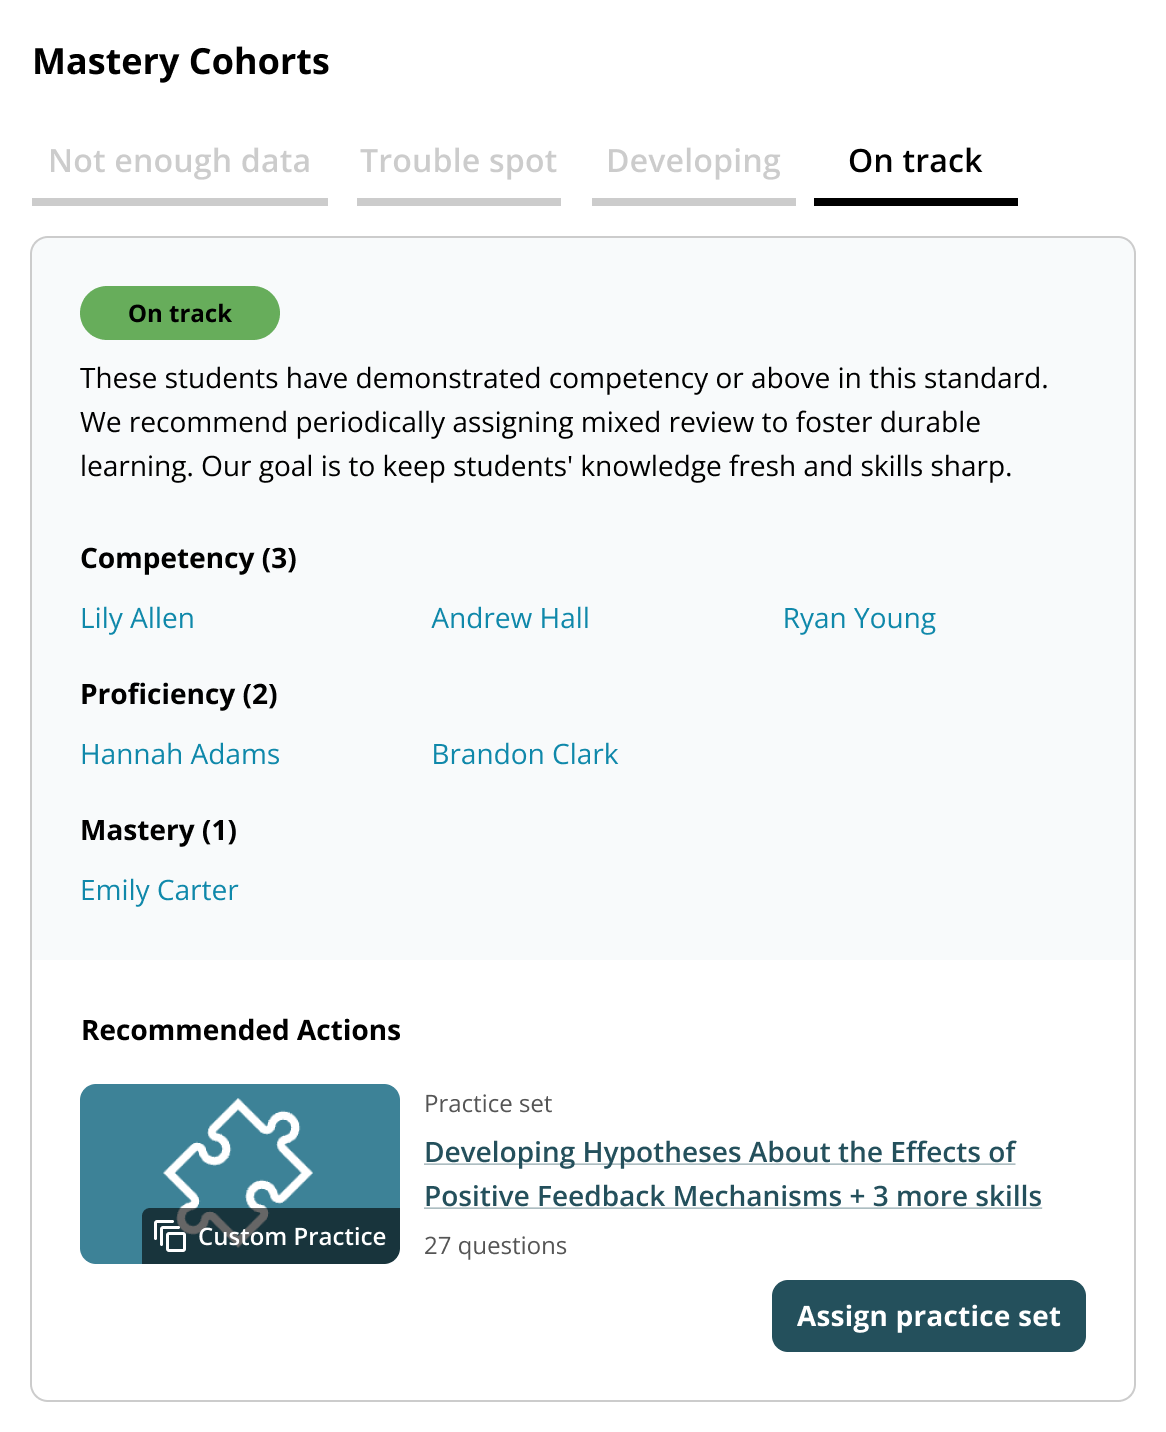
Grouping students by mastery level created a way to track progress and assign relevant next steps. Student progress was divided into three levels: Trouble spot, Developing, and On track. Students without enough test results stayed in the "Not enough data" level.
Each cohort came with a short explanation and a recommended action. For example, students who were on track could be assigned on-level practice to keep them sharp.
A beta for district partners
Student Mastery Monitoring launched in 2024 as a B2B beta with a set of hand-picked school districts. The Standard Mastery Details page included the snapshot, cohorts, skills, and relevant assignments.
Student Mastery Monitoring grew out of a teacher need, so teachers were included in every step of the design process. I conducted moderated and unmoderated user research to observe how teachers used this system and how I could make it more helpful. This feature helped our sales team grow the teacher business as we competed against traditional LMS platforms.